
Functions: Exponentials and Logarithmic Graph Transformations
Expressions and functions. This section covers:
- Transformations of the exponential graph
- Transformations of the logarithmic graph
Overview
Transformations of the exponential graph
Exponential graphs can be transformed in the same way as other graphs. You may be given such a graph and asked to find its formula. We use the results from the section on transformations of graphs, (section: Functions: Graphs and Functions) applied to the graph of y = ex.
Adding a constant to x moves the graph horizontally, and adding to the whole expression for y moves it vertically, so:
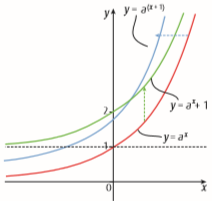
- y = a(x + 1) is the graph of y = ax moved 1 unit left (blue graph).
- y = ax + 1 is the graph of y = ax moved up 1 (green graph). A clue to this type would be the graph approaching the line y = 1 instead of the x-axis as x → −∞.
But notice that y = a(x + 1) = ax × a1 = a(ax). The effect of this is to multiply all the y-values on the graph of y = ax by a constant, a, which means the result is the graph of y = ax stretched vertically.
For more on this topic, have a look at our CfE Higher Mathematics Study Guide, p30-31.
Related Videos
For more on surds and indices, watch:
Thoughts
Sketch the graph of y = f(x), where f(x) = 3, log2(x + 4).
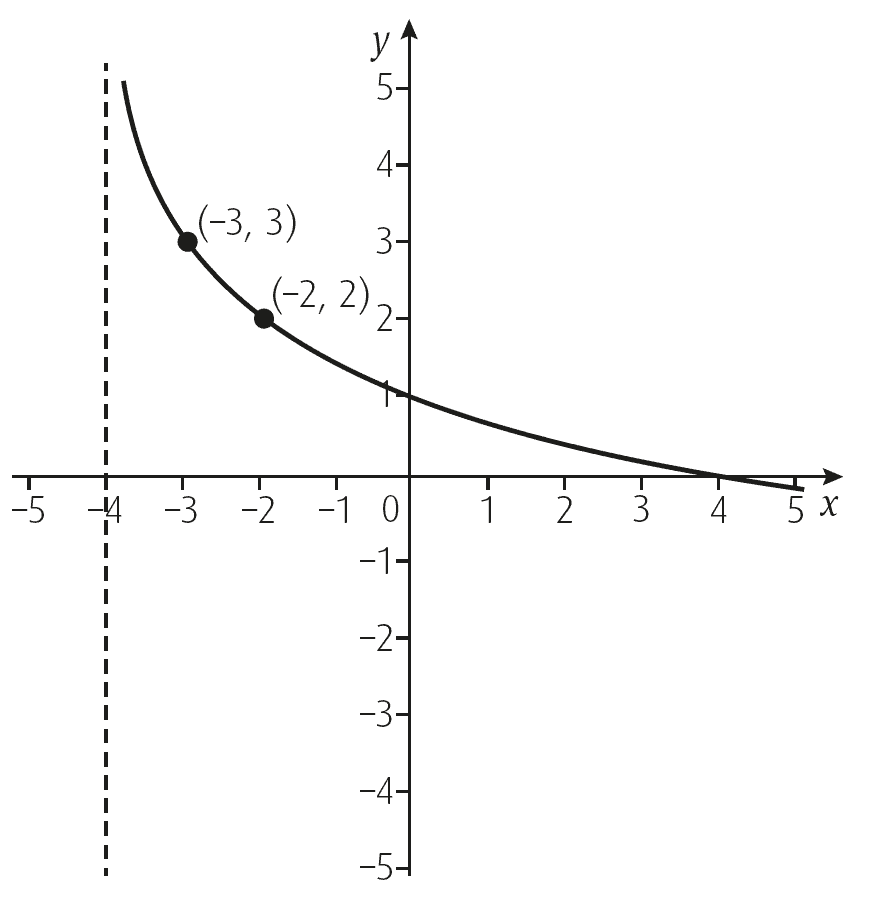
The graph will be translated by 4 units left
The graph will get closer and closer to the line given by x = −4 (the new asymptote instead of x = 0, the y-axis)
The graph will be reflected in the x-axis
The graph will be translated by 3 units upwards
The graph will need to be annotated: choose at least 2 points from (−3, 3),(−2, 2), (0, 1), (4, 0).