
Stellar Physics: Hertzsprung-Russell Diagrams
Stellar Physics: Hertzsprung-Russell Diagrams. This section covers:
- Hertzsprung-Russell diagrams
- Comparing stars with the same surface temperature
- Comparing stars with the same luminosity
Overview
Hertzsprung-Russell diagrams
The Hertzsprung-Russell (H–R) diagram is a scatter graph that plots the luminosity of a star against its surface temperature. When hundreds of known stars are entered on the H–R diagram the results are not a random scatter but fall into four distinct groups: main sequence, giants, supergiants and white dwarfs.
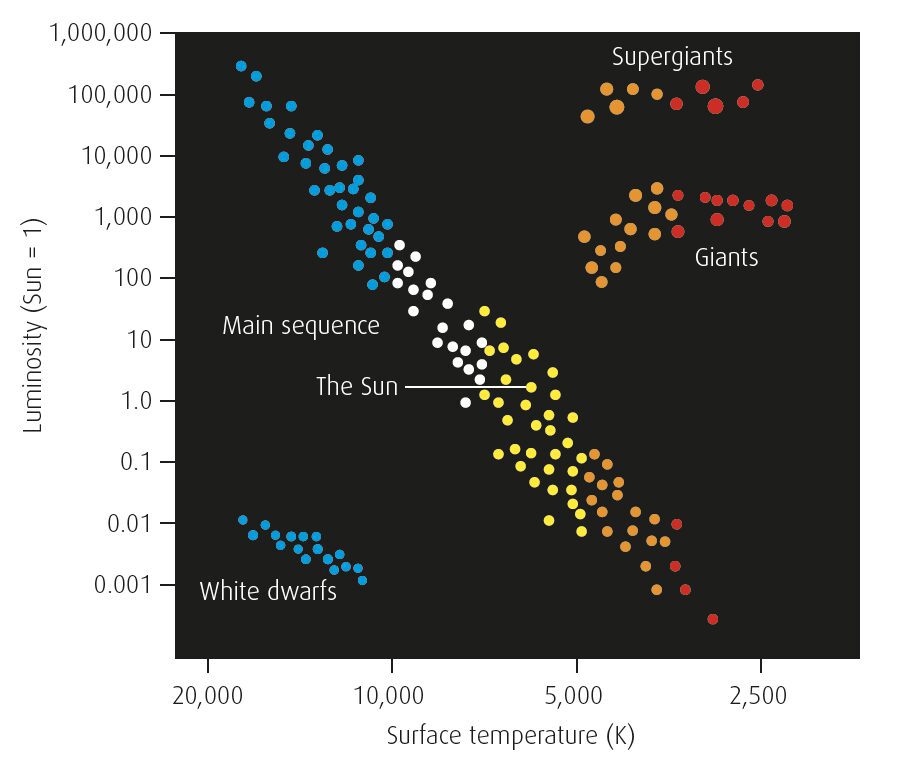
Comparing stars with the same luminosity
Barnard’s star and Sirius B have similar (low) luminosities. But Sirius B is much hotter with a greater surface temperature. The power output per unit surface area of Sirius B is much greater than that of Barnard’s star so Sirius B must have a much smaller surface area to account for this. Sirius B has a much smaller radius and smaller surface area than Barnard’s star.
For more on this topic, have a look at our Advanced Higher Physics New Edition Study Guide, pp. 50–51.
Quizzes
Click a link below to take a topic quiz:
Thoughts
1 In which region of the H–R diagram would you find
(a) a hot star with a low luminosity (a hot dim star)
(b) a cool star with high luminosity (a cool bright star)?
2 A star is hotter than the Sun and with a higher luminosity. What can be deducted about the radius of the star compared with the radius of the Sun?
3 Red dwarf stars form a subdivision of the main sequence at the bottom right of the H-R diagram. They are cooler, dimmer, smaller and less massive than the Sun. Proxima Centauri, the nearest star to the Sun, is a red dwarf. Red dwarf stars are predicted to live for trillions of years before turning into blue dwarfs. Blue dwarf stars are hypothetical at the present time and none have been observed. Can you think why none have been found yet?